
Deaf Equity in Financial Services 2026 Annual Report – Appendix
Dr Kate Rowley:
Although there is currently no published research directly examining the relationship between language deprivation and financial literacy in deaf populations, we can draw well-supported inferences based on what we know from research into language abilities of deaf children and adults. Dr Kate Rowley of the Deafness, Cognition and Language (DCAL) Research Centre at the University of London has extensively examined the language abilities of deaf children and adults – across both spoken and signed languages – and how these skills relate to other domains such as literacy and cognitive development. The research consistently demonstrates that language skills, regardless of modality, are strong predictors of broader outcomes including reading comprehension and key cognitive abilities such as executive function (Botting et al., 2016; Jones et al., 2019), working memory (Marshall et al., 2015), and theory of mind (Meristo, Hjelmquist & Morgan, 2012; Morgan et al., 2014).
A central finding in DCAL’s work is that many deaf people experience language deprivation in early childhood due to reduced or inconsistent access to a fully accessible language environment. When deaf children do not receive rich input in a natural language – spoken, signed, or both – during the sensitive period for language acquisition, this delays the development of foundational linguistic structures. The research has shown that this has cascading consequences for literacy development and for cognitive skills that rely on language for internal reasoning, self-regulation, perspective-taking, and information processing. Reports from the National Deaf Children’s Society (NDCS) also show that deaf pupils, on average, achieve lower GCSE results than their hearing peers, including in Mathematics.
Taken together, the evidence makes it clear: where there are lower levels of early language access, there are predictable downstream impacts on multiple academic and cognitive domains.
Financial literacy requires a combination of:
- Strong language comprehension (to understand complex written financial information)
- Numeracy and mathematical reasoning
- Executive function (planning, decision-making, evaluating risk)
- Working memory (holding multiple pieces of information in mind)
- Theory of mind (understanding perspectives in financial agreements or negotiations)
DCAL’s research clearly shows that all of these skills are shaped, directly or indirectly, by early language access. Therefore, it is reasonable to conclude that many deaf children and adults who experienced language deprivation are at heightened risk of having lower financial literacy compared to their hearing peers. Difficulties with reading dense financial documents, understanding contractual terms, or navigating financial decision-making are understandable consequences of earlier linguistic and cognitive impacts.
This does not reflect innate ability, but rather the long-term effects of unequal access to language and education. Recognising this relationship is essential for designing accessible financial education, ensuring that deaf people receive clear, linguistically appropriate information, and addressing yet another area in which language deprivation creates preventable disadvantage.”
Graphs
*All percentages are based on applicable responses only (excluding “N/A”).
Meeting me in person: which support needs and circumstances do you enable customers to record on their profile? (2026)
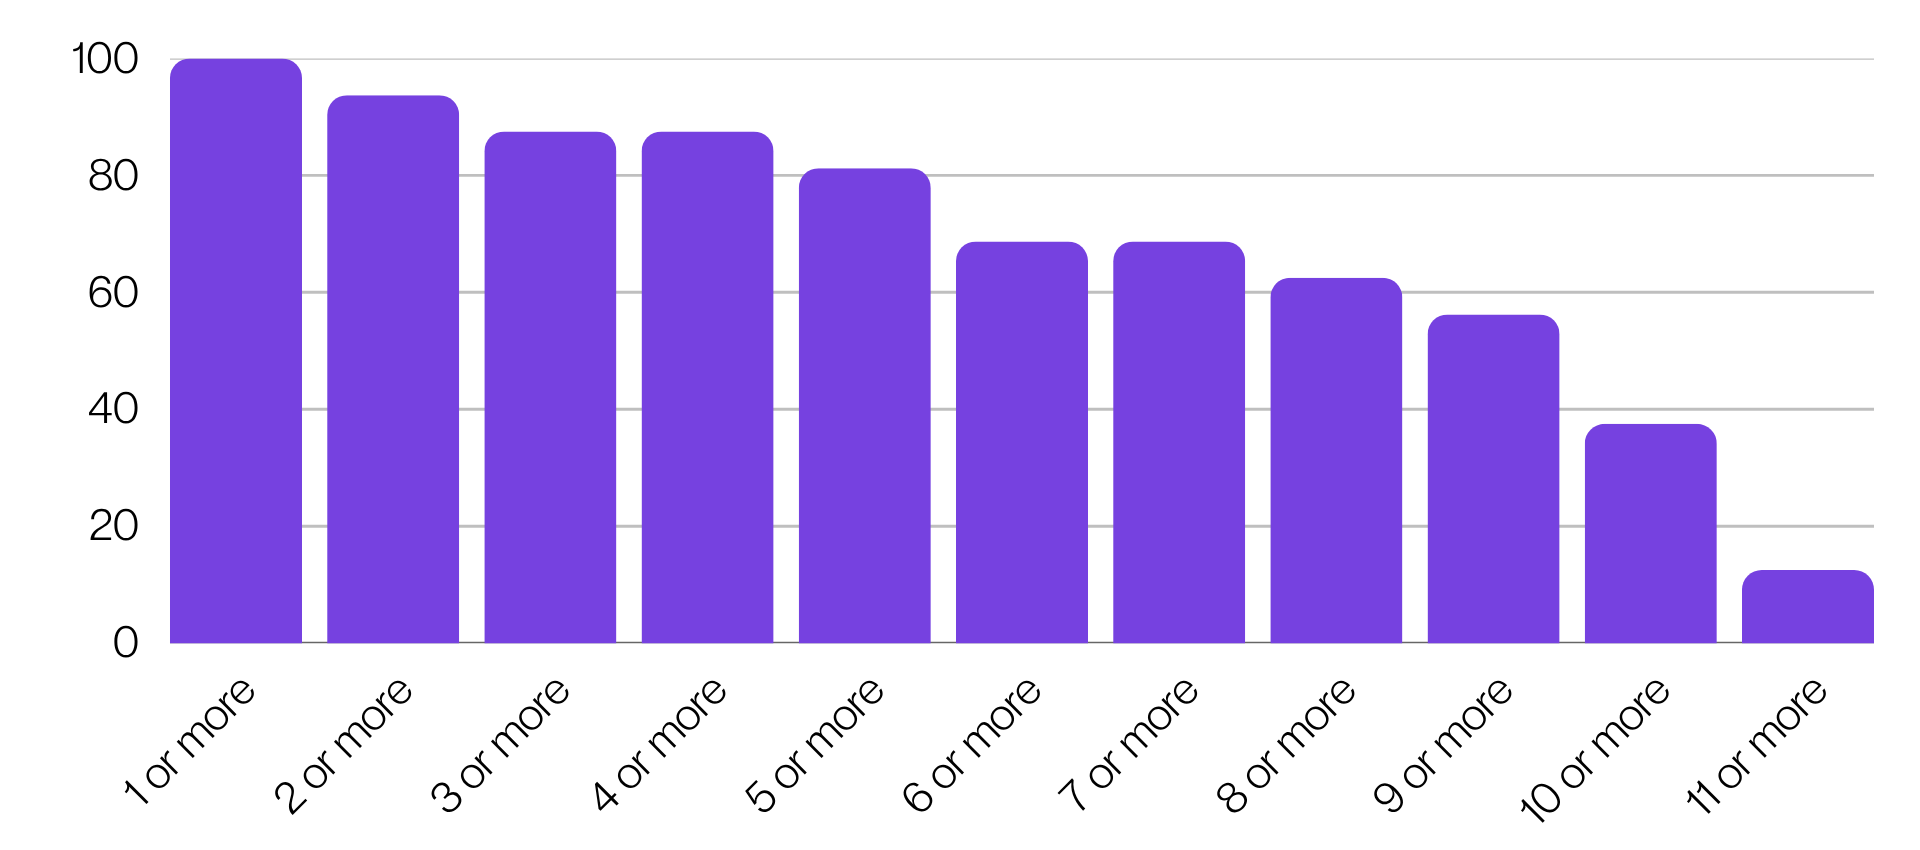
A vertical bar chart titled “Meeting me in person: which support needs and circumstances do you enable customers to record on their profile? (2026)”. The horizontal (x) axis shows the number of support needs or circumstances organisations enable customers to record, ranging from “1 or more” through to “11 or more”. The vertical (y) axis shows percentage values from 0 to 100 in increments of 20.
The bars are arranged in descending order. “1 or more” is at 100%, indicating all organisations allow at least one support need to be recorded. The percentage gradually decreases as the number increases, with high values for “2 or more” and “3 or more”, followed by a steady decline through the mid-range categories. There is a sharper drop in the final categories, with “11 or more” showing a very low percentage.
Interacting with me: which support needs and circumstances do you enable customers to record on their profile? (2026)
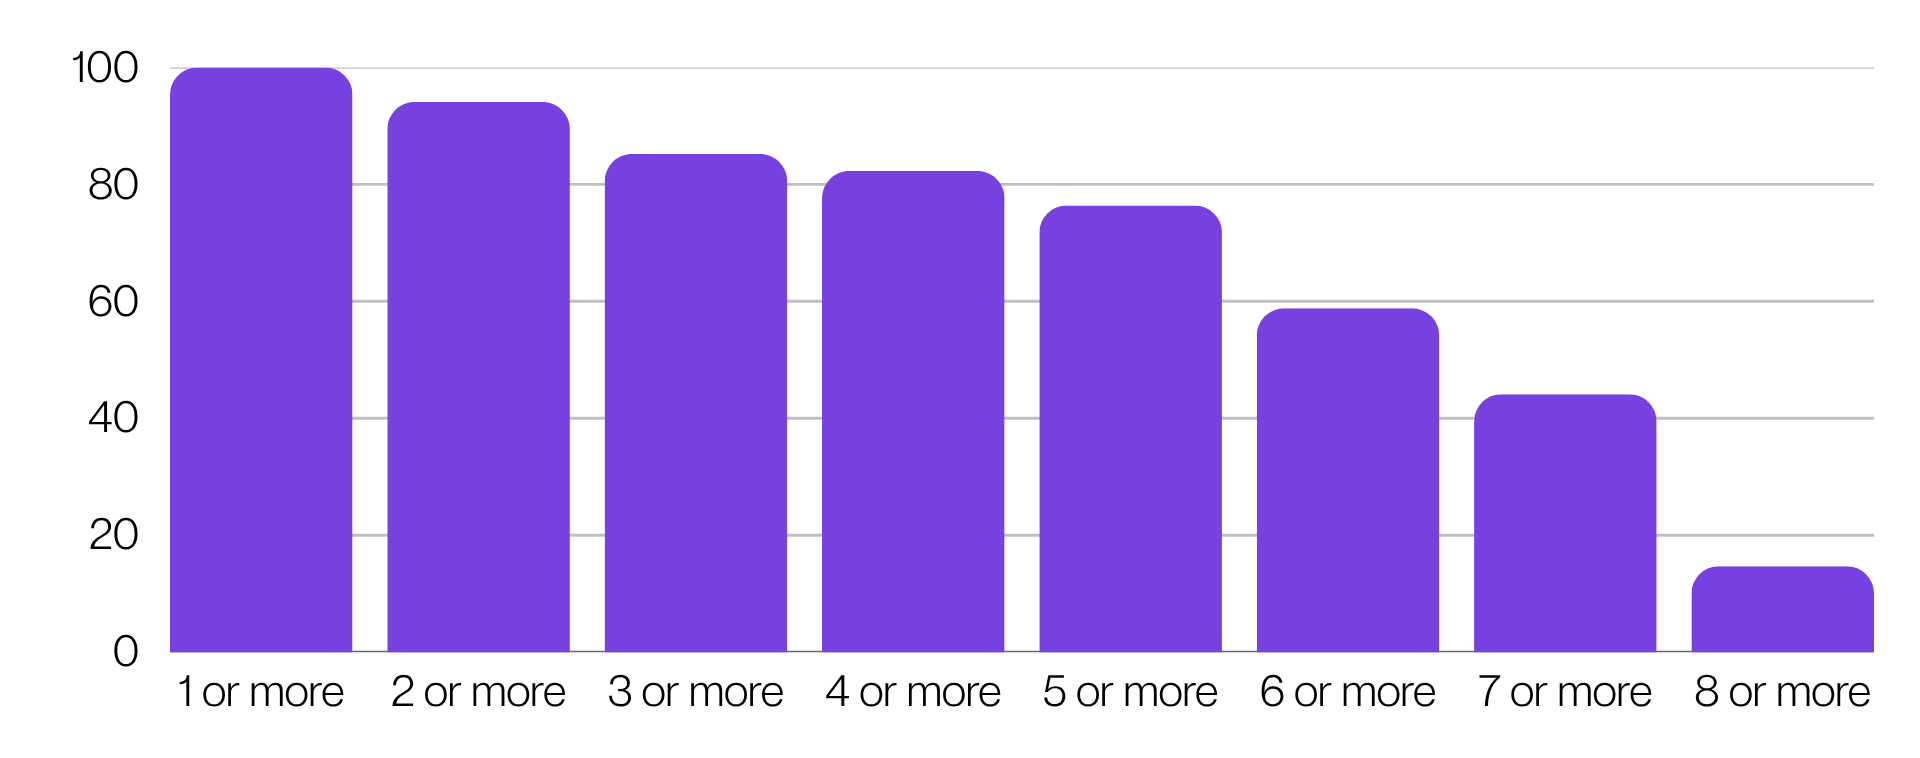
A vertical bar chart titled “Interacting with me: which support needs and circumstances do you enable customers to record on their profile? (2026)”. The horizontal (x) axis shows the number of support needs or circumstances organisations enable customers to record, ranging from “1 or more” through to “8 or more”. The vertical (y) axis shows percentage values from 0 to 100 in increments of 20.
The bars are arranged in descending order. “1 or more” is at 100%, indicating all organisations allow at least one support need to be recorded. The percentage decreases as the number increases, with relatively high values for “2 or more” and “3 or more”, followed by a steady decline across the mid-range categories. There is a more noticeable drop for “6 or more” and beyond, with “8 or more” showing a low percentage.
Support for deaf colleagues: support avenues offered (2026)
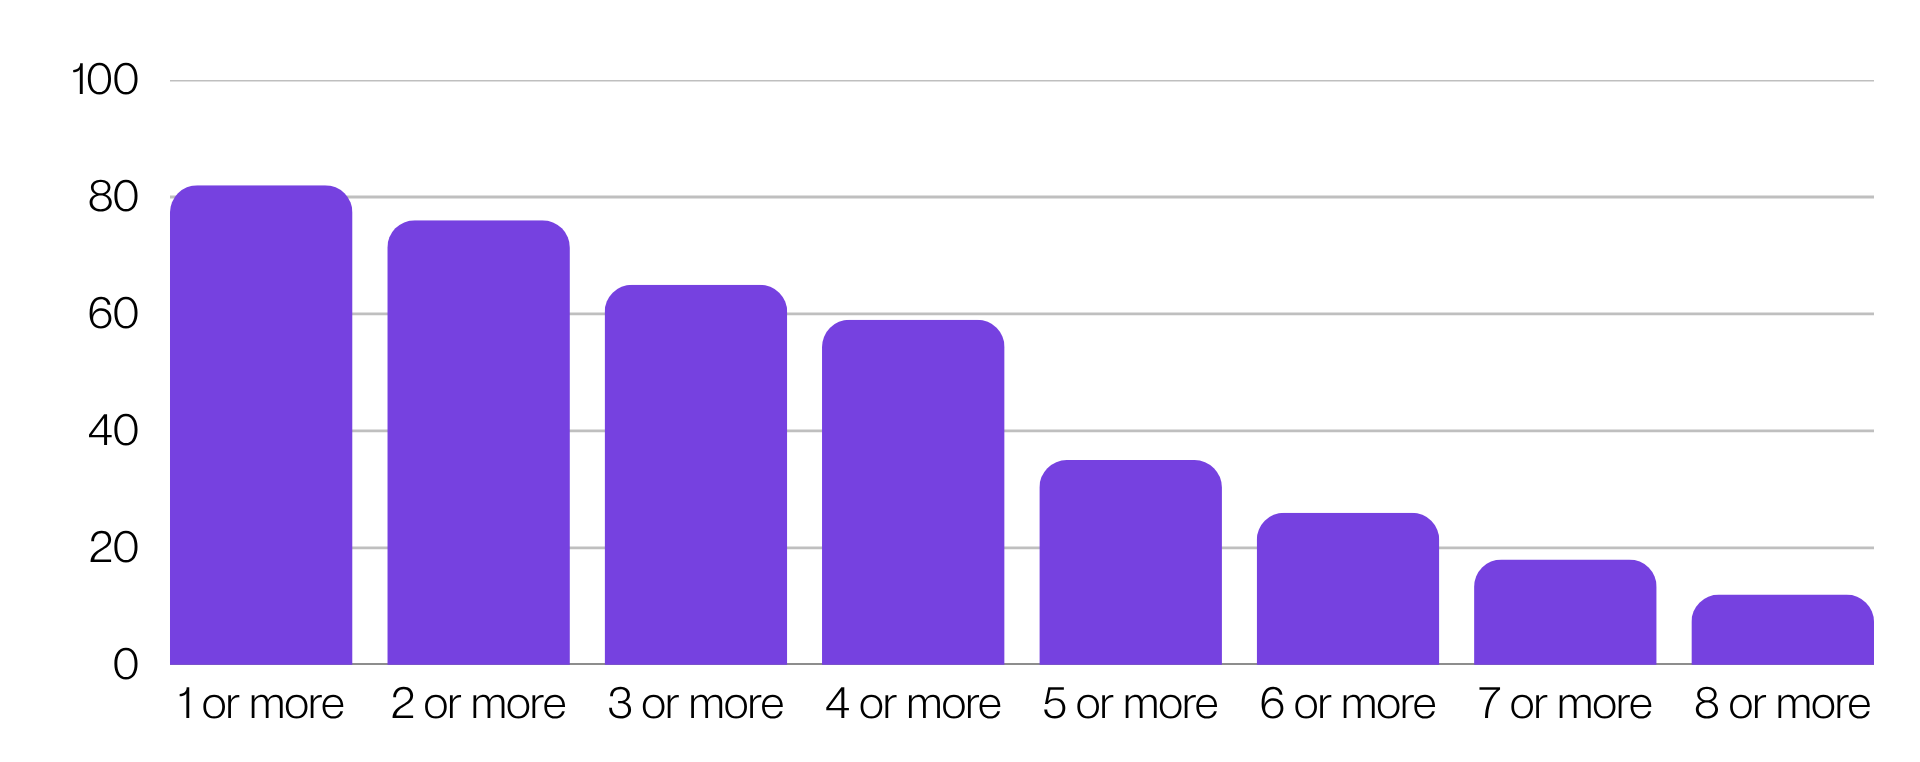
A vertical bar chart titled “Support for deaf colleagues: support avenues offered (2026)”. The horizontal (x) axis shows the number of support avenues organisations offer to deaf colleagues, ranging from “1 or more” through to “8 or more”. The vertical (y) axis shows percentage values from 0 to 100 in increments of 20.
The bars are arranged in descending order. “1 or more” is the highest, at just over 80%, indicating most organisations offer at least one support avenue. The percentage decreases steadily as the number increases, with moderate values for “2 or more”, “3 or more”, and “4 or more”. There is a sharper drop from “5 or more” onwards, with “8 or more” showing a low percentage, indicating that only a small proportion of organisations offer a wide range of support avenues.
How many services do you offer for deaf customers? (2026)
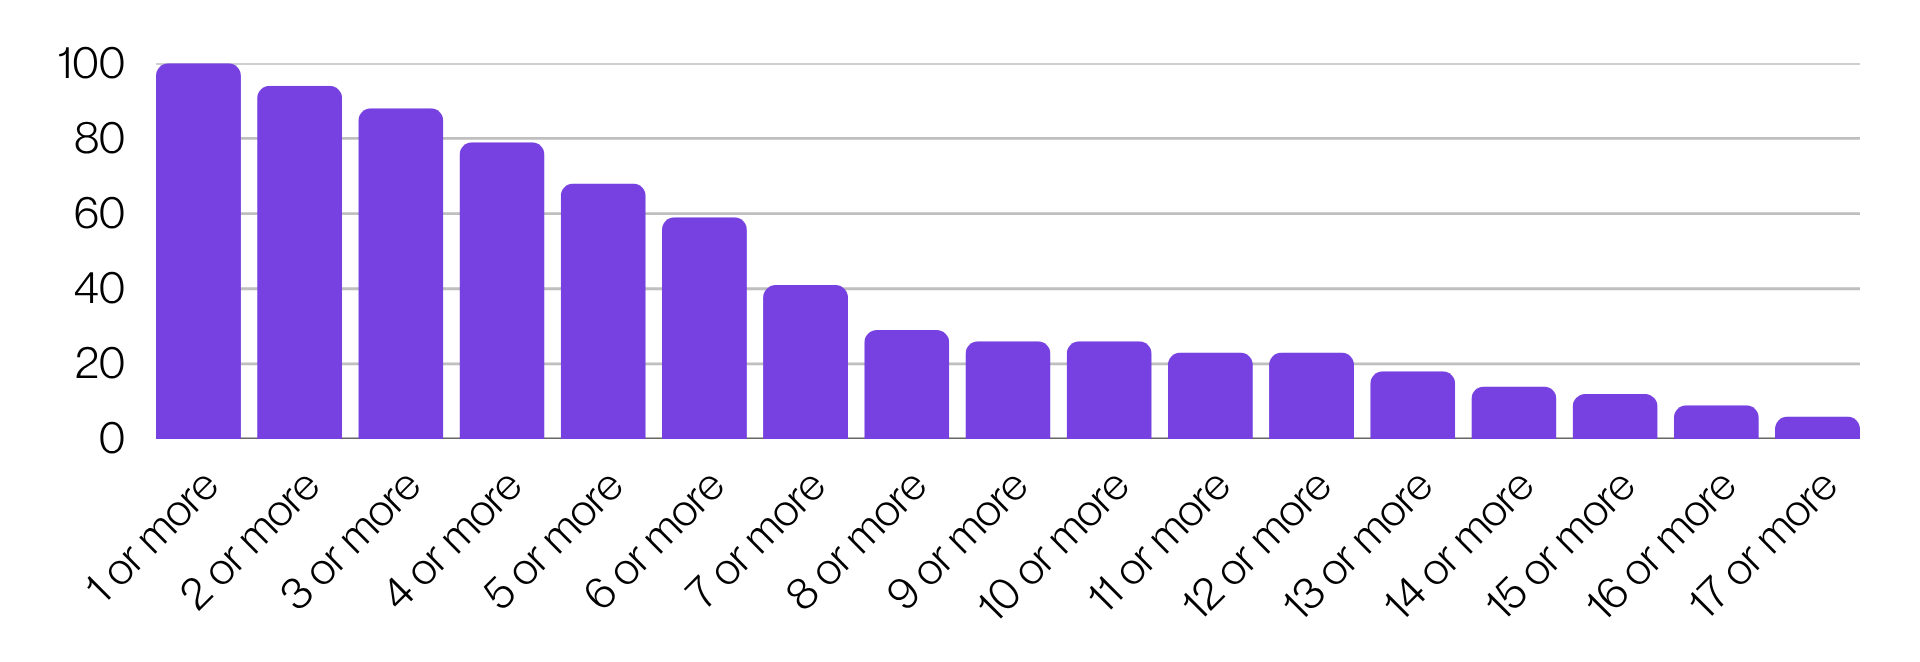
A vertical bar chart titled “How many services do you offer for deaf customers? (2026)”. The horizontal (x) axis shows the number of services organisations offer for deaf customers, ranging from “1 or more” through to “17 or more”. The vertical (y) axis shows percentage values from 0 to 100 in increments of 20.
The bars are arranged in descending order. “1 or more” is at 100%, indicating all organisations offer at least one service. The percentage remains high for “2 or more” and “3 or more”, then steadily declines through the mid-range categories. There is a more noticeable drop from around “7 or more” services onwards. The highest service counts, such as “15 or more”, “16 or more”, and “17 or more”, have very low percentages, indicating that only a small proportion of organisations offer a wide range of services.
What services do you offer deaf customers? (2026)
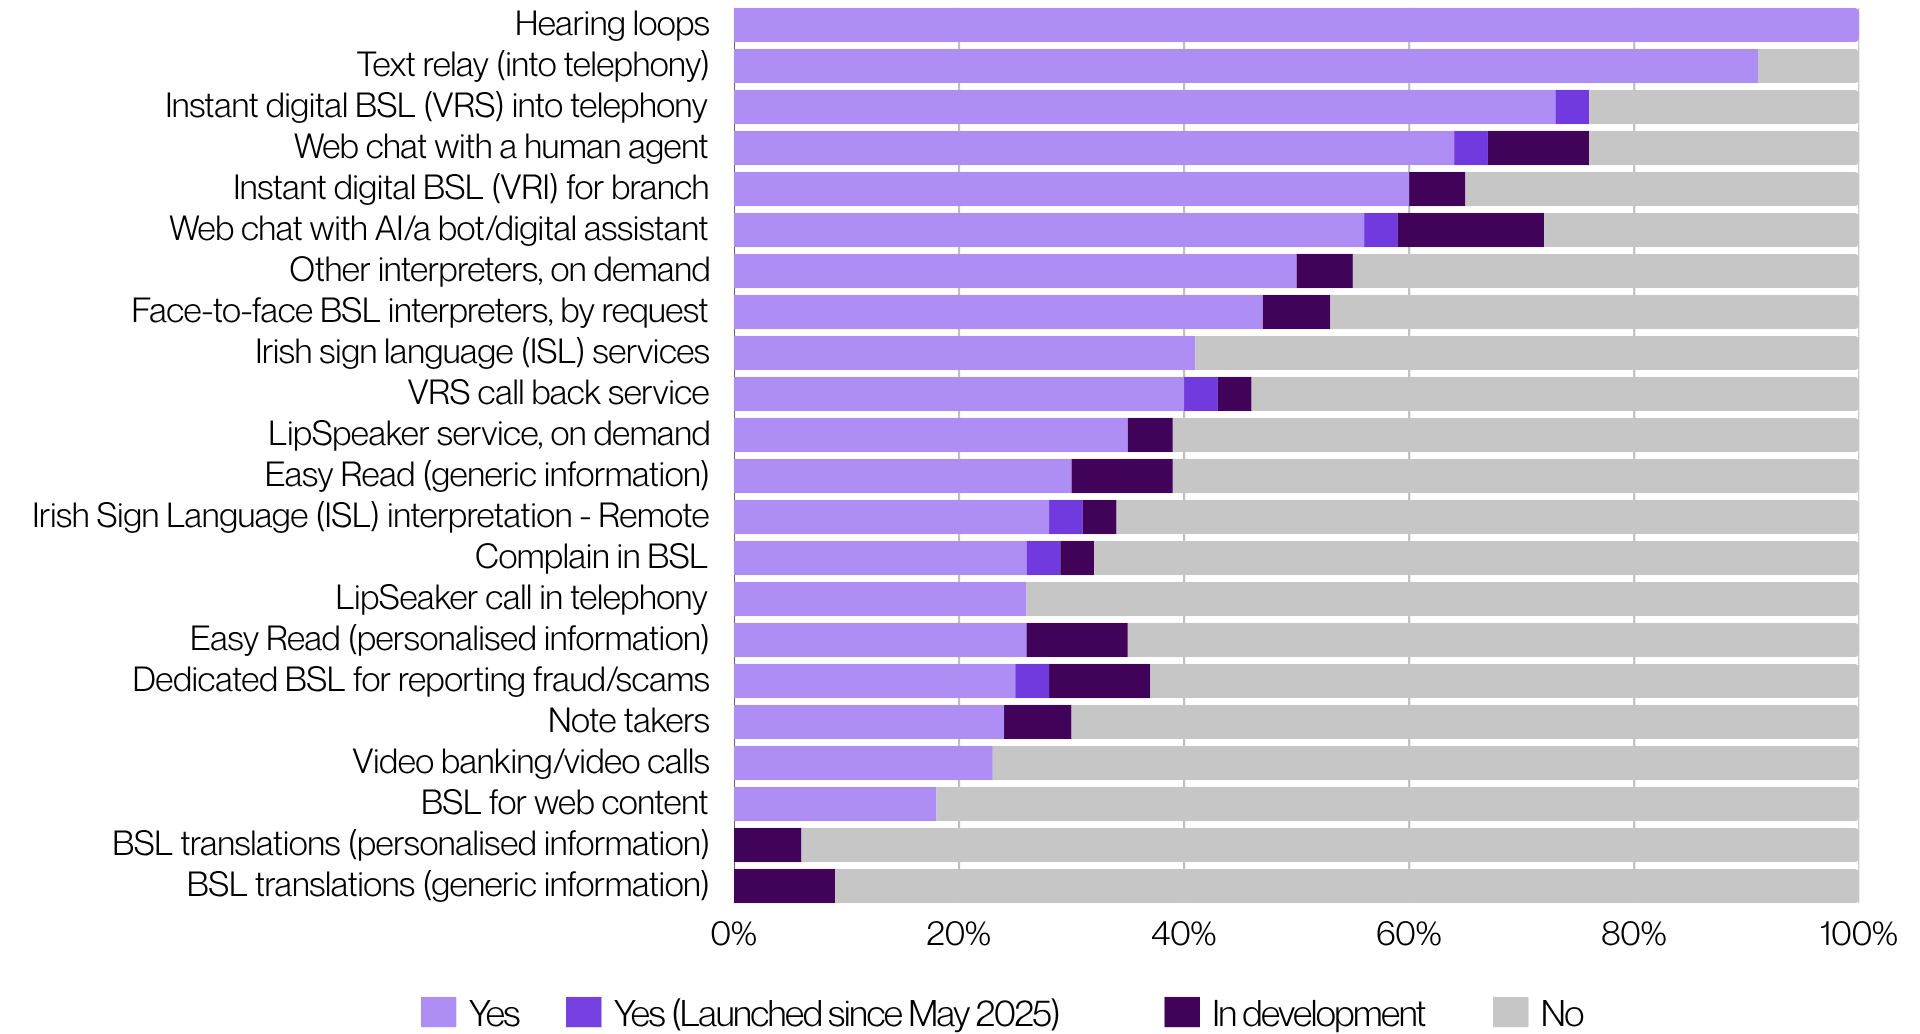
A horizontal stacked bar chart titled “What services do you offer deaf customers? (2026)”. The vertical (y) axis lists a range of services provided to deaf customers, including hearing loops, text relay, BSL video relay services (VRS), web chat, interpreters, and accessible information formats. The horizontal (x) axis shows percentage values from 0% to 100%. Each bar represents a service and is divided into four segments:
- light purple for “Yes”,
- mid purple for “Yes (launched since May 2025)”,
- dark purple for “In development”,
- grey for “No”.
The chart shows that some services – such as hearing loops, text relay, and VRS – are widely offered, with most organisations indicating “Yes”. Other services, such as AI chat, interpreters on demand, and face-to-face BSL interpreters, show more mixed availability, with a combination of “Yes”, “In development”, and “No”. Lower down the chart, services such as Easy Read formats, ISL interpretation, BSL complaint handling, and fraud/scam reporting in BSL are less widely available, with larger grey “No” segments. The least commonly offered services include BSL translations (both personalised and generic), which show very low levels of availability and high proportions of organisations not offering them.
Overall, the chart highlights strong provision of core communication services, but a clear drop-off in more specialised, proactive, or content-based accessibility services.
Year on Year Comparison – What services do you offer deaf customers?
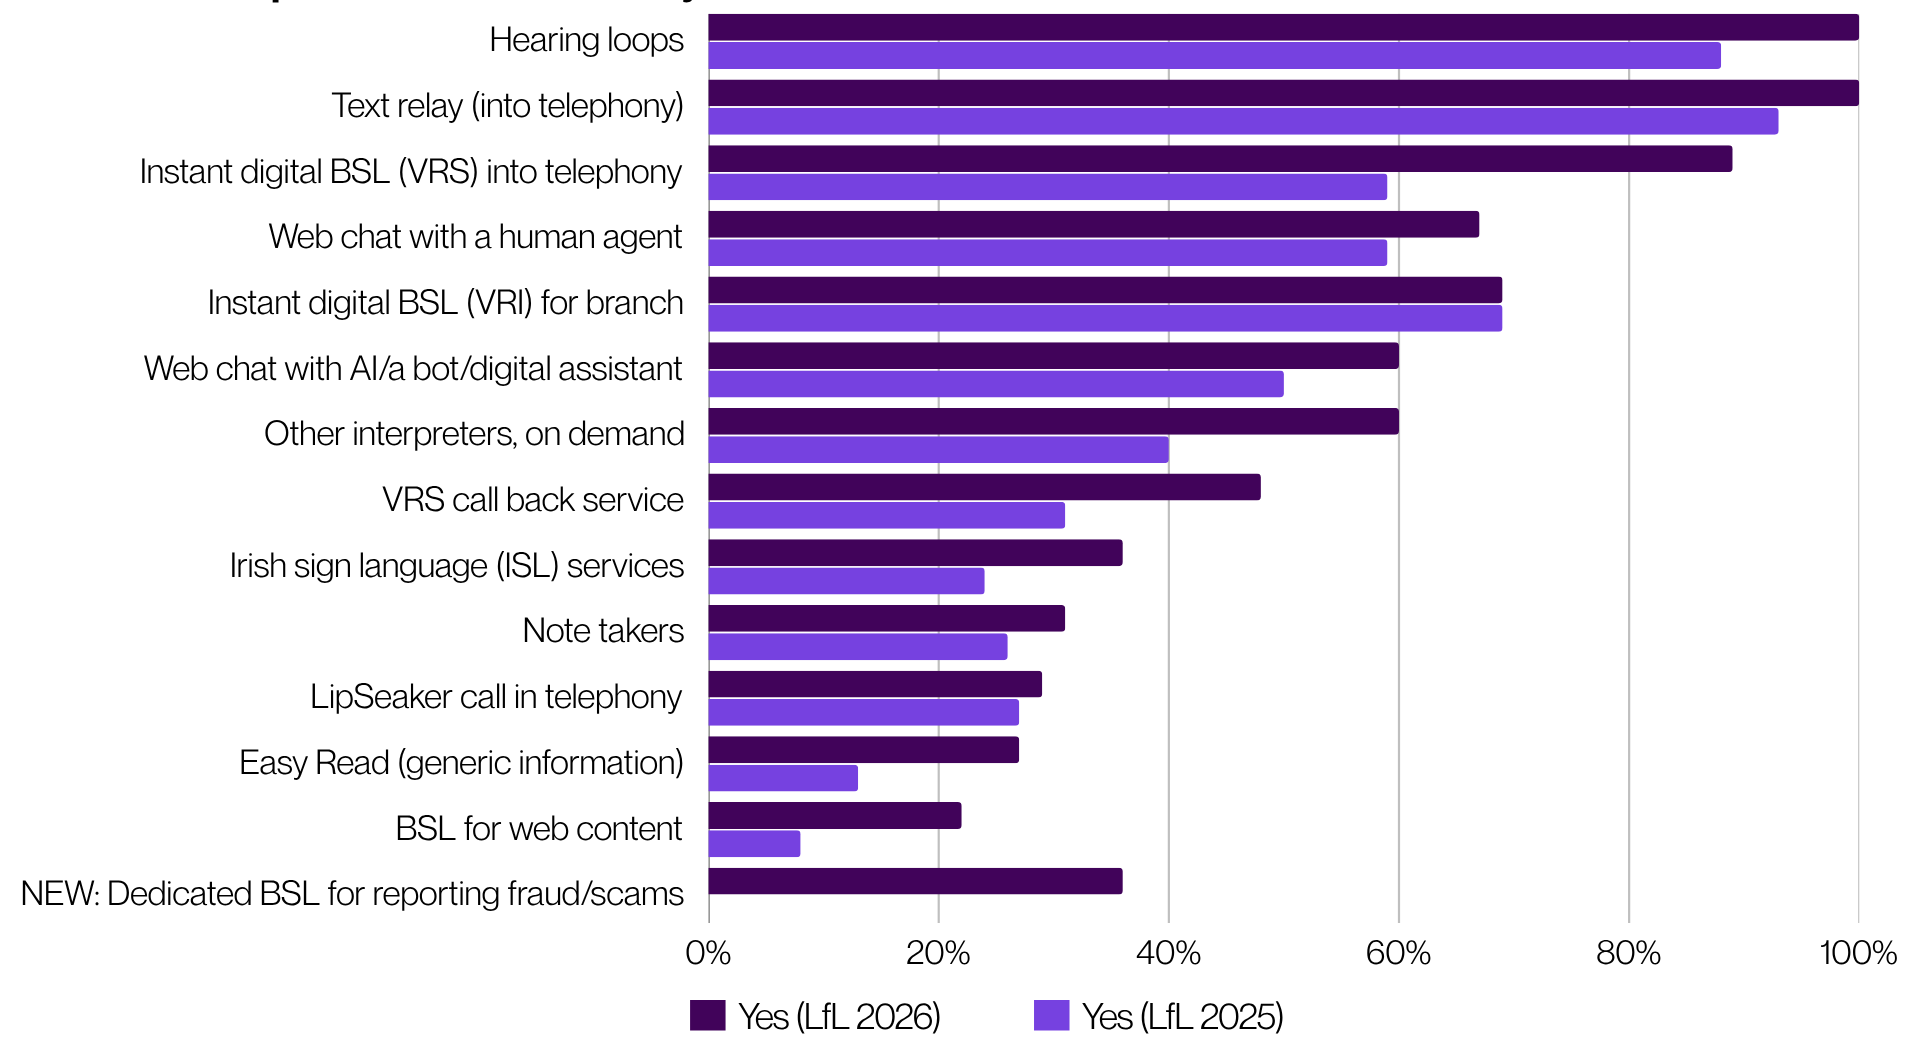
A horizontal bar chart titled “Year on Year Comparison – What services do you offer deaf customers?”. The vertical (y) axis lists services offered to deaf customers, including hearing loops, text relay, BSL video relay services (VRS), web chat, interpreters, and accessible formats. The horizontal (x) axis shows percentage values from 0% to 100%. Each service has two bars: a darker purple bar representing 2026 and a lighter purple bar representing 2025.
Across most services, the 2026 bars are longer than the 2025 bars, indicating increased availability year on year. The highest levels of provision are seen for hearing loops, text relay, and VRS, with values close to or at 100% in 2026. Mid-range services such as web chat with a human agent, VRI for branch, and AI chat show moderate increases. Lower down the chart, services such as ISL services, note takers, lip speaker support, Easy Read information, and BSL for web content remain less widely available, although most still show some improvement compared to 2025. A new category, “Dedicated BSL for reporting fraud/scams”, appears only in 2026 at a relatively low percentage.
Overall, the chart shows consistent year-on-year growth in service provision, with the largest gains in core communication services and more gradual progress in specialised or content-based support.
Year on Year Comparison – Interacting with me: Which support needs and circumstances do you enable customers to record on their profile?
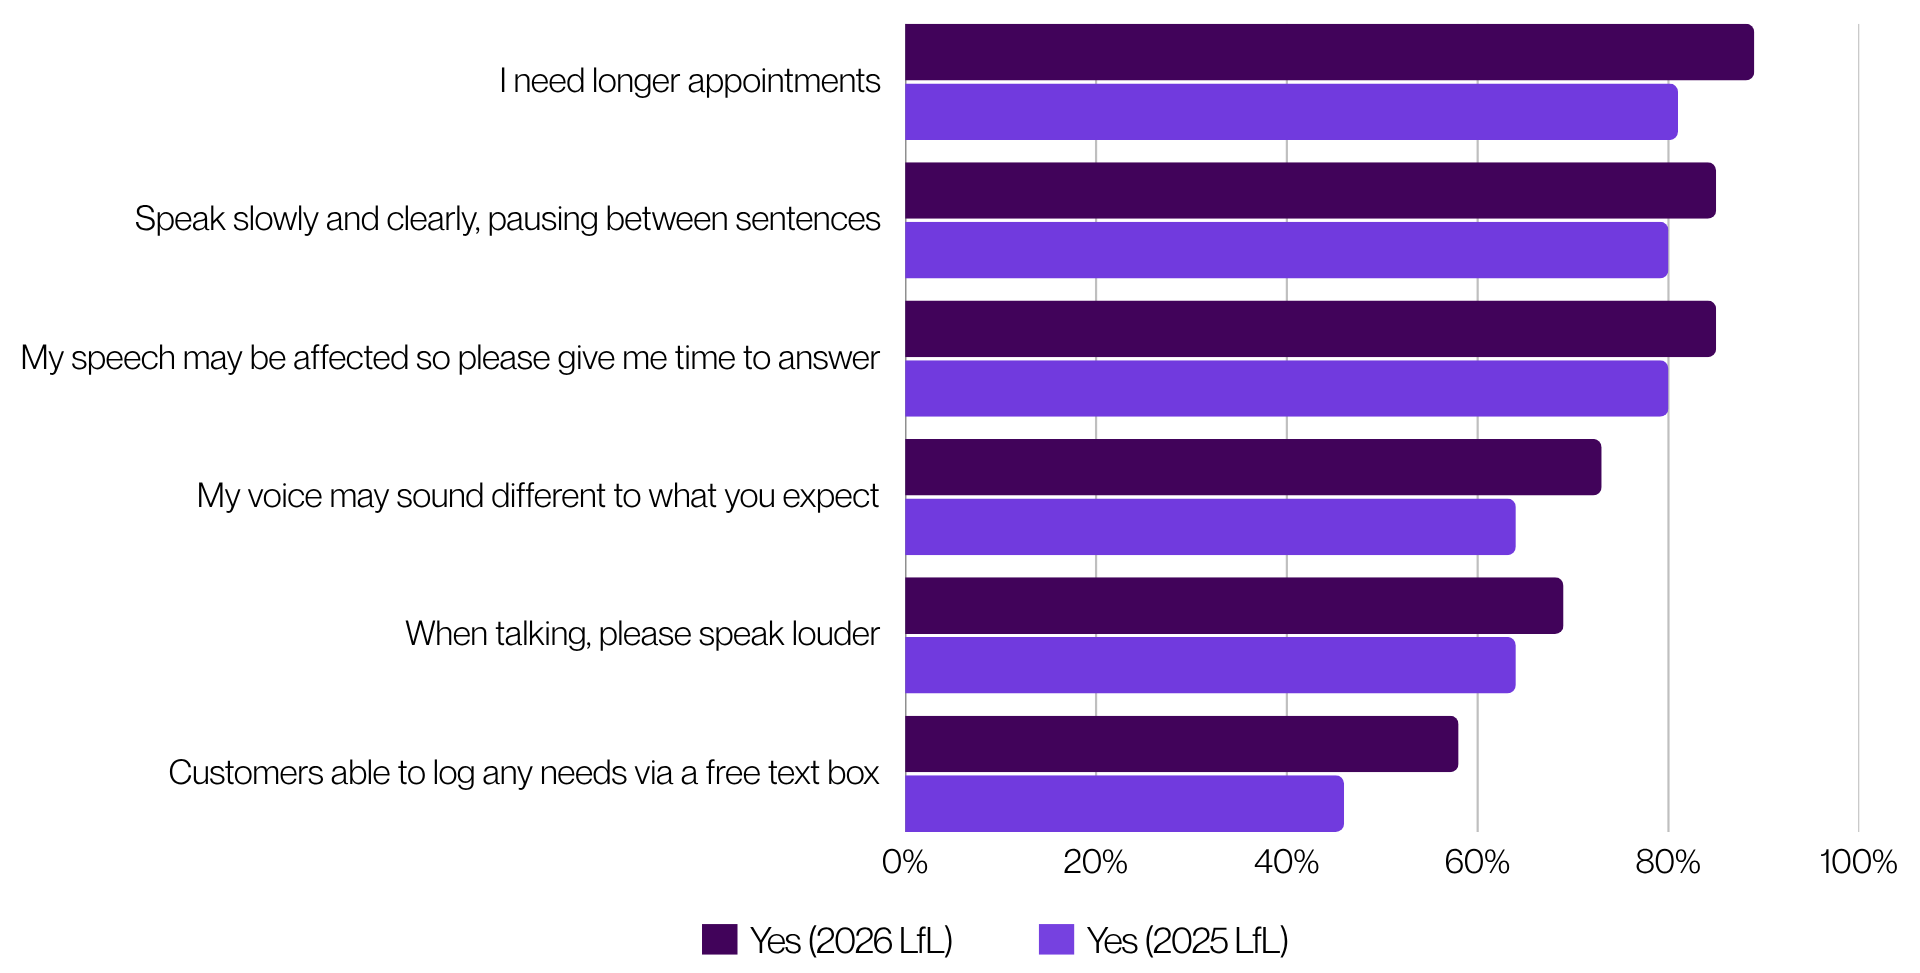
A horizontal bar chart titled “Year on Year Comparison – Interacting with me: which support needs and circumstances do you enable customers to record on their profile?”. The vertical (y) axis lists specific support needs or circumstances, including needing longer appointments, requests for clear and slower communication, allowing extra time to respond, voice differences, speaking louder, and the ability to log needs via a free text box. The horizontal (x) axis shows percentage values from 0% to 100%. Each category has two bars: a darker purple bar representing 2026 and a lighter purple bar representing 2025.
Across all categories, the 2026 values are higher than 2025, indicating improvement year on year. The highest levels of provision are for enabling longer appointments and supporting clear, paced communication, both close to or above 80–90% in 2026. Mid-range values include allowing extra time to respond, recognising voice differences, and speaking louder, generally around 60–75%.
The lowest levels of provision are for allowing customers to log needs via a free text box, which, while improved from 2025, remains significantly lower than the other categories.
Overall, the chart shows consistent progress in enabling customers to record support needs, but highlights that more flexible or open-ended approaches—such as free text input—are less widely implemented.
Year on Year Comparison – Support for deaf colleagues
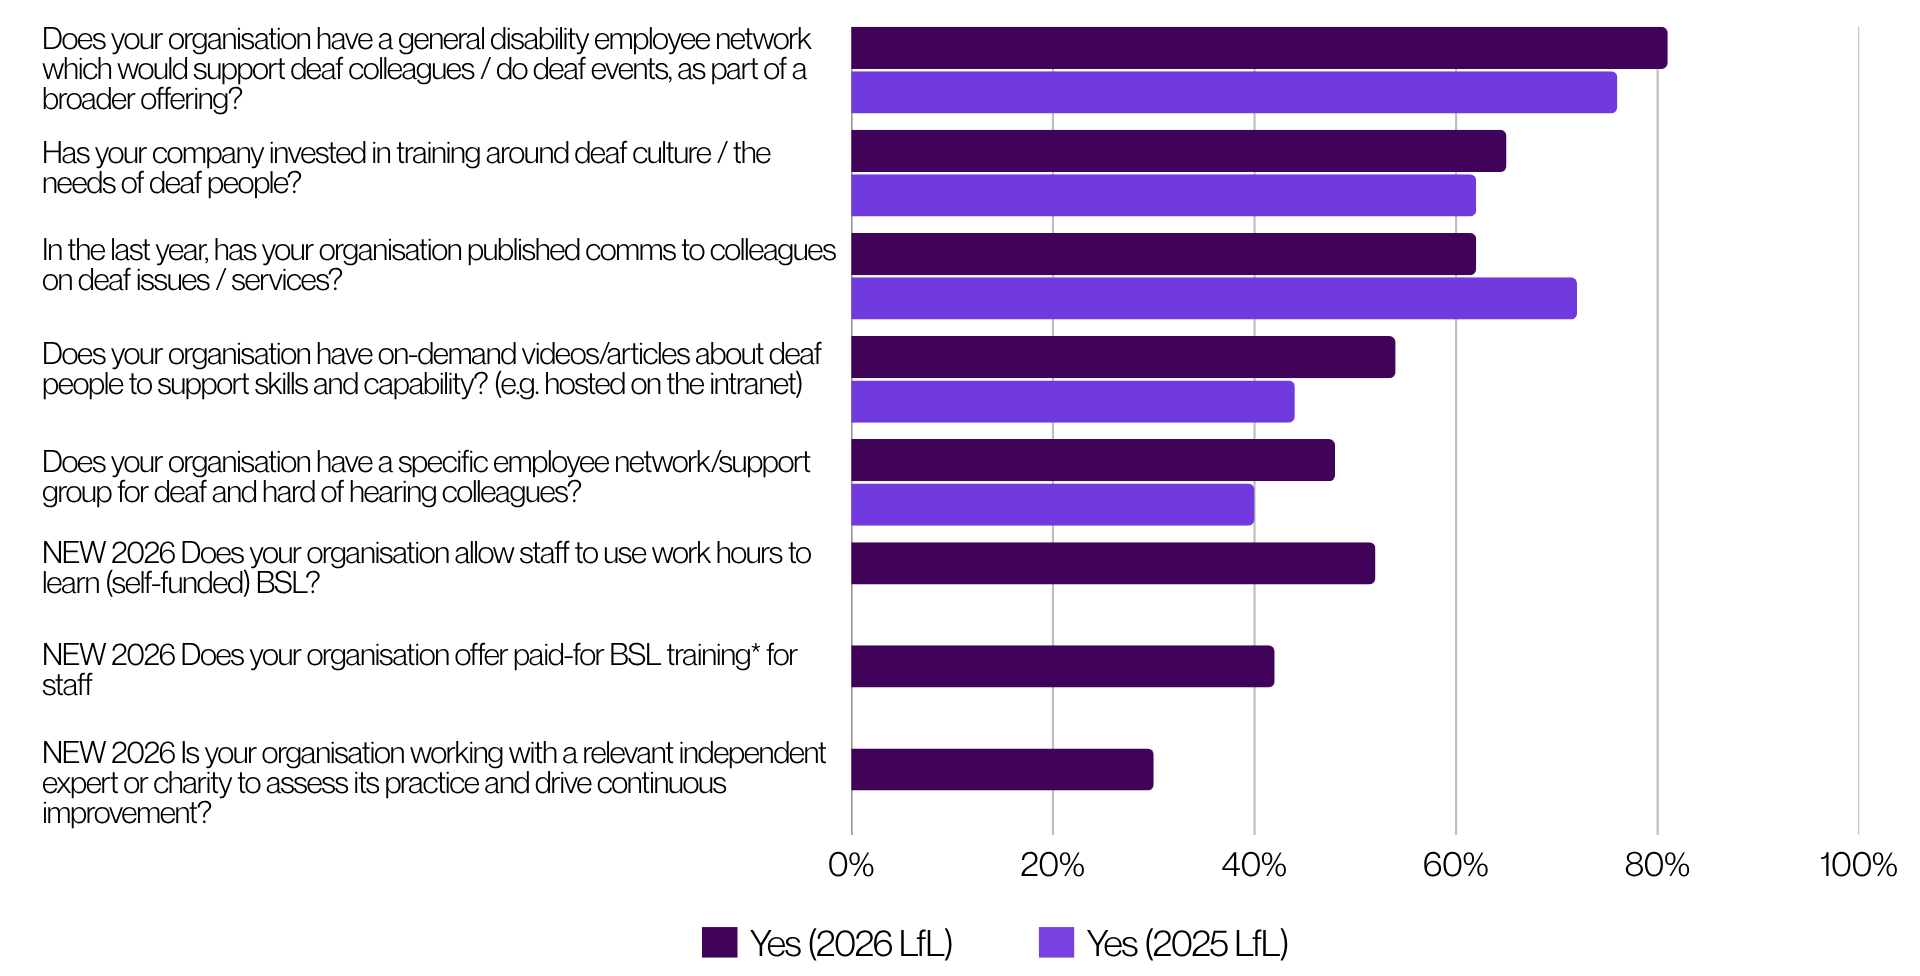
A horizontal bar chart titled “Year on Year Comparison – Support for deaf colleagues”. The vertical (y) axis lists different types of organisational support for deaf colleagues, including employee networks, training on deaf culture, internal communications, on-demand learning content, and dedicated support groups. Additional new 2026 measures include allowing staff to use work hours to learn British Sign Language (BSL), offering paid-for BSL training, and working with external experts or charities. The horizontal (x) axis shows percentage values from 0% to 100%. Each category has two bars: a darker purple bar representing 2026 and a lighter purple bar representing 2025, where available. Some newer 2026 categories only show a single bar.
Most categories show higher values in 2026 compared to 2025, indicating increased organisational support. The highest levels of support are seen in general disability employee networks and internal communications, both around 70-80% in 2026. Training on deaf culture and on-demand content show moderate uptake, while dedicated support groups for deaf colleagues are less common.
The new 2026 measures show mixed adoption: allowing time during work hours to learn BSL is moderately adopted, paid-for BSL training is slightly lower, and working with external experts or charities is the least common.
Overall, the chart shows steady progress in workplace support for deaf colleagues, with continued gaps in more formalised training, dedicated networks, and external partnership approaches.